Program grows from 8% of ethanol capacity represented to 40%
Twenty years ago, benchmarking solved a problem for John Christianson and his clients. Starting in the 1990s, Christianson worked with ethanol startups on their financial strategies for raising equity and, once operational, with their accounting. “They were doing fine, but operating in isolation they didn’t know how well they were doing or what they should be doing,” he recalls. And because of the accounting profession’s confidentiality standard, he couldn’t make comparisons when asked. Thus, benchmarking was born.
Recruiting enough plants to protect anonymity, Christianson Benchmarking launched in 2003. Eight plants in four states began sharing key financial and operations data to learn how they compared with their peers. Today, more than 70 subscribers can run queries to compare their performance with the whole group, or just plants in their region, plants of a similar size, by technology or a number of other factors. “If I’m analyzing grind margin,” Christianson gives as an example, “I may want to compare myself to the plants closest to me, because they will have a similar corn basis. There’s the opportunity to be very granular.”
In Wentworth, South Dakota, Dakota Ethanol was one of the early subscribers, says long-time board member Ron Alverson. “One thing we learned when we first started was that our cost for repair and maintenance was quite a bit higher than other ethanol plants. We asked, how are they doing it, how can we do better,” he recalls. The management team continues to use benchmarking to grade themselves, he says, and while many of the improvements made aren’t very big, “lots of little things add up.”
“Our number one use of benchmarking is in our operations group,” says Jason Marquis, chief operating officer at Marquis Energy, Hennepin, Illinois. “They get a blind comparison of what I call controllable spend—enzymes, yeast, antibiotics. It gives our group an external validation of being competitive here but not there.” And, to the extent the data is representative of the industry, it gives the management team macro insights, he says. “It gives you a little understanding of what most people in the industry are doing in terms of where and how they’re selling their products, when and how they’re buying corn,” he adds. Pricing reports for commodities like ethanol, DDG, natural gas, electricity, “gives you a sense of how the industry as a whole is structuring those contracts.”
Early in the program, the benefit from corn oil extraction emerged from benchmarking data, Christianson recalls. “The other was the benefit from self-procurement of grain for cost and quality. Next it was really going after ethanol yield—benchmarking put dollars to that, and what it looks like. Today, pushing yield drops carbon intensity, which is going to be the next big thing. We’re adapting the program to be very granular about carbon, allowing plants to see where they need to improve.”
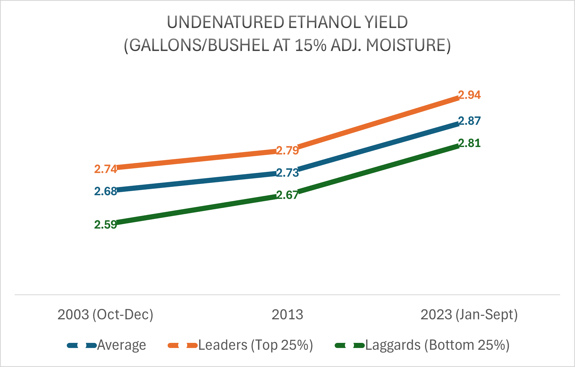
Ethanol yields have steadily improved to where today’s “laggards” (the bottom 25% quartile) get more gallons for each bushel of corn processed than the “leaders” (the top 25%) did in 2003. With the average plant grinding about 25 million bushels of corn these days, says Connie Lindstrom, senior biofuels analyst for Christianson Benchmarking, that yield increase means an ethanol producer gets 5 million additional gallons of ethanol today from the same amount of corn when compared to 2003. That is more than 163 additional rail cars of ethanol, or enough additional E85 for about 12,000 vehicles for a year. Lindstrom also analyzed the yield gain in gallons per acre of corn. In 2003 USDA reported a national average corn yield of 142.2 bushels per acre and in 2023 an estimated 173 bu/a. Multiply that by the average ethanol yield per bushel and in 2003, the ethanol industry produced 381 gallons per acre of corn.
After years of being a division of the accounting firm Christianson LLLP, a couple of years ago Christianson Benchmarking was spun off as an independent entity with John as president. Connie Lindstrom works on the team as senior biofuels analyst and Sandy Holtberg as program manager. Holtberg handles training of new subscribers and day-to-day interactions. Lindstrom focuses on data analysis, compiling standard quarterly reports and custom analyses.
“Most plants use the program for the financials,” Lindstrom says. “Looking for cost savings, making sure their marketers are doing a good job, measuring yield and revenue.” In the past couple of years, she’s seen a shift from focusing on driving cost of production as low as possible to more attention being paid to factors impacting carbon intensity. In response, more data points are being collected to facilitate more detailed reporting on energy use.
Another data expansion is being planned, Lindstrom adds. “We’re trying to get more detailed data so we can answer questions like how high pro feed or industrial alcohol is impacting overall revenue,” she says. Information that could be considered proprietary is only shared with the companies providing the data, she adds, until the number of participants reaches the point where the data becomes anonymous.
Benchmarking data gets used far beyond the board rooms and staff meetings of individual plant subscribers. “Our goal is to help make the industry better,” Christianson says, describing the program as being by the industry for the industry. Data is shared with the Department of Energy, USDA and other researchers, as well as industry trade associations.
“At the American Coalition for Ethanol, we use the benchmarking data routinely for our annual fly-ins,” says CEO Brian Jennings. “We take a lot of charts and use those visuals with members of Congress to show how ethanol producers continue to improve in efficiency.”
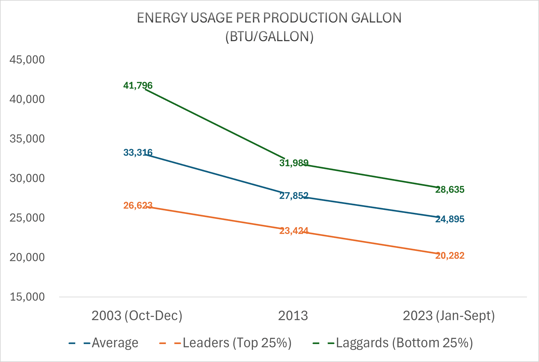
Thermal energy used to produce a gallon of ethanol has dropped dramatically over the 20 years of benchmarking data. Lindstrom says that while the vast majority of participants use natural gas, over the years some have used coal or propane. “Keep in mind these energy reductions have occurred despite an increase in the amount of distillers grains being dried, and an increase in the number of plants generating some of their own electricity,” she says, adding that the leaders dry very little distillers grains. This coming year, they will begin tracking the energy used in the ethanol process separately from what is used to power dryers or generators to give a truer picture of the carbon intensity of the ethanol produced.
“The benchmark data is definitely good and helpful for people to see the state of the industry,” says Michael Wang, director of the systems assessment center at Argonne National Laboratory. His team relied upon benchmark data for ethanol yield and energy use alongside USDA data for corn farming in its 2021 paper: “Retrospective analysis of the U.S. corn ethanol industry for 2005-2019: implications for greenhouse gas emission reductions.” The study data was used to update key corn ethanol parameters in the GREET 2021 release.
The benchmarking data serves an important role, says Kurt Rosentrator, professor of agricultural and bio systems engineering at Iowa State University. Years ago, USDA Economic Research Service conducted a biannual survey of ethanol companies used by many to understand industry trends. “They stopped collecting that data more than a decade ago,” he says. “That information and reports were used in lots of scientific publications.” Benchmarking fills a critical hole for researchers and policymakers.
The program’s 70-some plants is the highest in its 20-year history, Lindstrom says, but she’d like to see even greater participation. “For statistical purposes, 8 or 10% is valid,” she says. “And 40% is an amazing amount of information. But when talking about convincing the general public and policy makers about the industry’s efficiency gains, 40% isn’t enough. Michael Wang tells us 50 or 60% would be better.” She likens it to the classic chewing gum commercial. “Remember when they’d say, ‘Four out of five dentists approve…?’ Saying ‘Two out of five…’ just doesn’t sound as good,” she says.
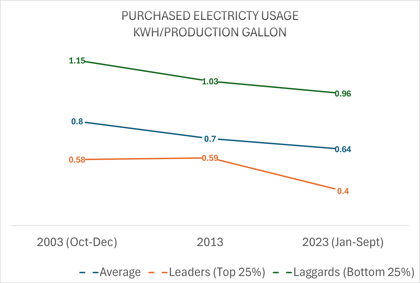
Purchased electricity per gallon of ethanol produced has been dropping as more plants implement technologies to generate electricity internally from recovered energy, as well as improvements in equipment efficiency and some adoption of renewable energy systems.
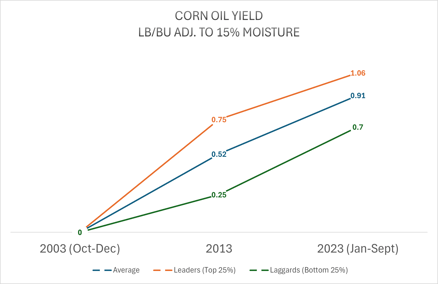
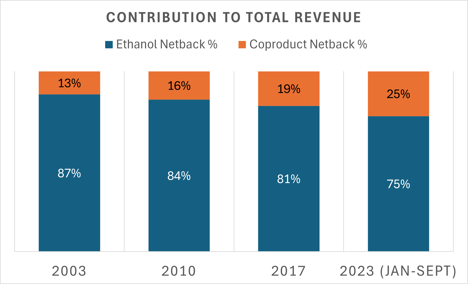
Corn oil extraction began a couple of years after benchmarking started in 2003. Data showing the advantages of the new technology contributed to its rapid adoption. In recent years as corn oil’s value is skyrocketing as a feedstock for renewable diesel, coproduct contribution to the bottom line is increasing. Now the data shows the push is on to increase corn oil yields.
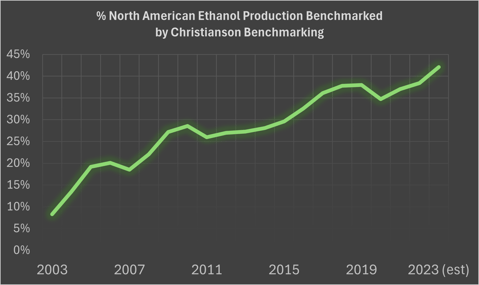
Participation: Christianson Benchmarking began 20 years ago with eight plants in four states receiving six reports assessing the operational and financial efficiency of participants. Initially representing an 8-10% sample, benchmarking today includes roughly 40% of the industry and represents the range of sizes, locations and organizational structures seen in the whole industry. More than 70 subscribers in the U.S. and Canada access multiple standard and custom reports from hundreds of specialized calculations utilizing more than 300 data points. Recently, Brazilian ethanol producers began benchmarking, although that data remains confidential until enough are covered to ensure anonymity.
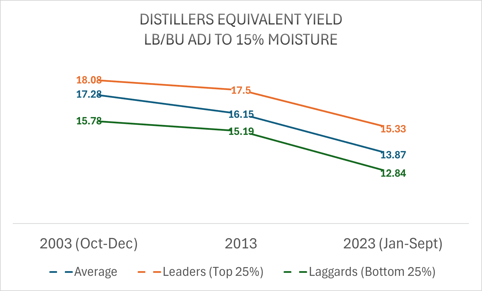
The yield of distiller grains has declined over the years as yields improve for ethanol and corn oil, which is the desired result as DGs are the least profitable product, Lindstrom says. “One area in which we’ve added more data collection points is in the nutritional profile of livestock feed products,” she adds, which will facilitate assessment of the value and market penetration of specialty feed products such as high-protein feed. Initially, only those providing data will receive reports for their facilities, until enough participate to guarantee anonymity.